Houston

Art City : Science City

Artist Statement
About the data
The Hackathon
Tech Stack

Spatial Distribution

Hypothesis

Are there science and art deserts or do they mirror population alone?

Art Observations (l):

There is wider distribution than I would have thought. The extent of distribution between science and art isn't that different

Science Observations (r):

Given Houston is known for certain industries (oil, NASA, health) I thought to see more clustering around the areas most known for that.

What Questions Do These Observation Bring Up?

With this plot, you mostly see geographic extent. What are density of events/jobs where the dots overlap? That is hard to see from this.

Spatial Density

Hypothesis

There would be a single art cluster & maybe 3 science (health, oil, space)

Art Observations (l):

There is a cluster of highest density of values (and also events!) just south of downtown.

Science Observations (r):

The clustesr I was expected aren't as dominate as I expected,but there is denser locations just north and west of downtown, which you don't see in art venues. Additionally, you see NASA, which has a lot of science but not much art, saddly.

What Questions Do These Observation Bring Up?

This plots makes me wonder what companies employ scientists in multiple places and what venues have the most shows!

Neighborhoods

Hypothesis

Can we see neighborhoods of our most common industries?

Science Observations (r):

Yes! Though not as cleanly as maybe I thought might be possilbe?

What Questions Do These Observation Bring Up?

Wonder how many companies do work in multiple industries. For example, Jacobs works for all three major industries but especially petroleum and space.

Do our 3 most well known industries make up most science jobs?

We should see clusters of jobs with totals in order of health, petroleum, other, and then space.

Observations

My predicted order is close to being correct with more in "other" column than expected. Some of the ads categorized as "petroleum" or "space" are either in both, large engineering companies for example, or hard to tell where they should go. For example, a job description that has 'physics' in it can be ambiguous.

What Questions Do These Observation Bring Up?

This plots makes me wonder what companies employ scientists in multiple places and what venues have the most shows!

Event Counts per Art Venue Colored by Total Days of Events

Hypothesis

The museums and universities will have a large portion of the events?

Observations

The data shows smaller galleries are among the highest event per venue numbers. This is part due to their actual high numbers and short turn around of shows as well as the fact that after mid 2016 many of the largest museums and galleries were advertisted under a single page instead of multiple event pages! This can be seen better in other visualizations.

What Questions Do These Observation Bring Up?

It makes me wonder how differences in recording data could affect raw numbers over the history of Glastire. There is evidence of a change in mid-2016 but not definitive evidence of its exact nature.

Artist Statement

Background

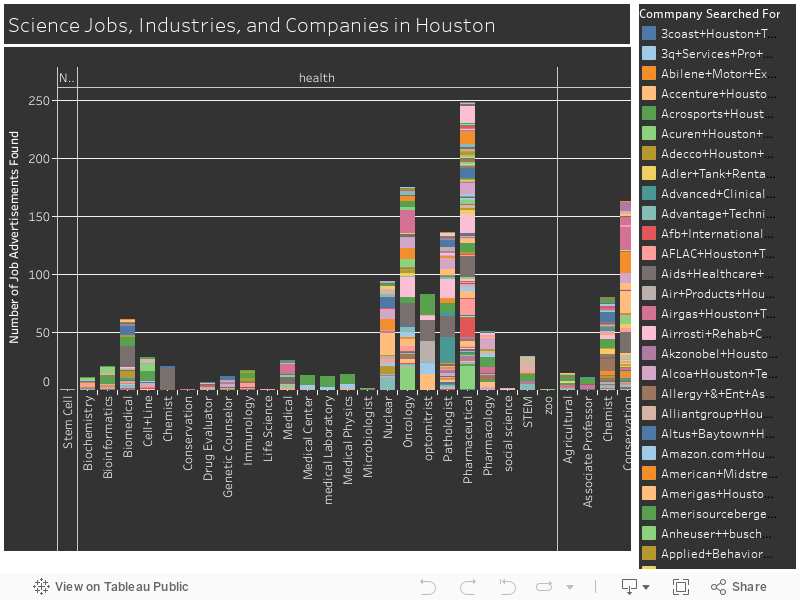
In late 2017, I got curious about the spatial distribution of where Science takes place in Houston. I couldn't find any maps or databases already created, so I attempted to figure out if I could generate a dataset from sources meant for a different purpose. I eventually settled on job advertisements. Although there isn't a flag on any site for "science jobs", I was able to find a list of terms associated with science jobs. I wrote a program to scrape job advertisements that a search returned when using words from that list of >100 science associated words. I got ~5000 results. However, the results were very very messy with a lot of false positives. Just one example, most "satellite" jobs are at "satellite locations, nothing to do with making satellites! Due to limited time and the difficulity cleaning through a large number of text descriptions, the project got put on the shelf (on github).

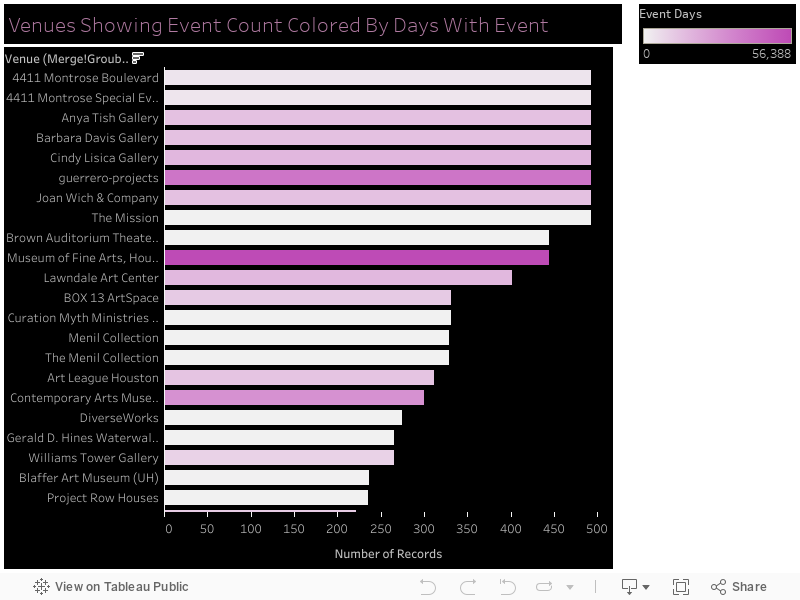
Inspired by the idea of spatially understanding Art in Houston, I decied to bring that dataset back out, clean it, and see if I could analyze both datasets the same way.

Machine-learning to assist in data cleaning

To start out, I labeled 1200 jobs as either "true" or "false" for actually being a science job. I think generated a Machine Learning model (random forest) to take my labeled data and use that to predict which ones of other job descriptions were real or not.

Goals for the project

1. Be able to analyze both the science dataset and the art dataset in identical or similar ways. I wanted to let the combination of the two drive the style of my analysis.

2. Wanted the appearance to have a visual theme.

3. Wanted to have finished product be live and editable on the web.

4. Wanted to be in a place where the general public could further explore the data and ask their own questions.

About the Data

Science Dataset: Locations of companies that advertised a job with science keywords in 2017. Scraped with python & cleaned with Scikit-learn machine-learning.

You can find more information about the generation and cleaning of the Science job dataset I created on its original github repository

Art Dataset: Locations of art events tied to art venue locations. includes artist unique identifiers but not names.

You can find more information about the art venue dataset provided by Glasstire on this site for the hackathon or on their main Glasstire website.

About the Organizer

Glasstire, being the online publication for art in Texas for 18 years, has compiled a unique dataset of art venues thrhougout Houston. The Glasstire DataHack asked participants to search for insights and visualizations.

Tech Stack

  1. Kepler.gl (map-based data visualization)
  2. Tableau (data manipulation and data visualization)
  3. Pandas (data manipulation & cleaning)
  4. HTML, CSS, JS (web developement)
  5. Scikit-learn (machine-learning)