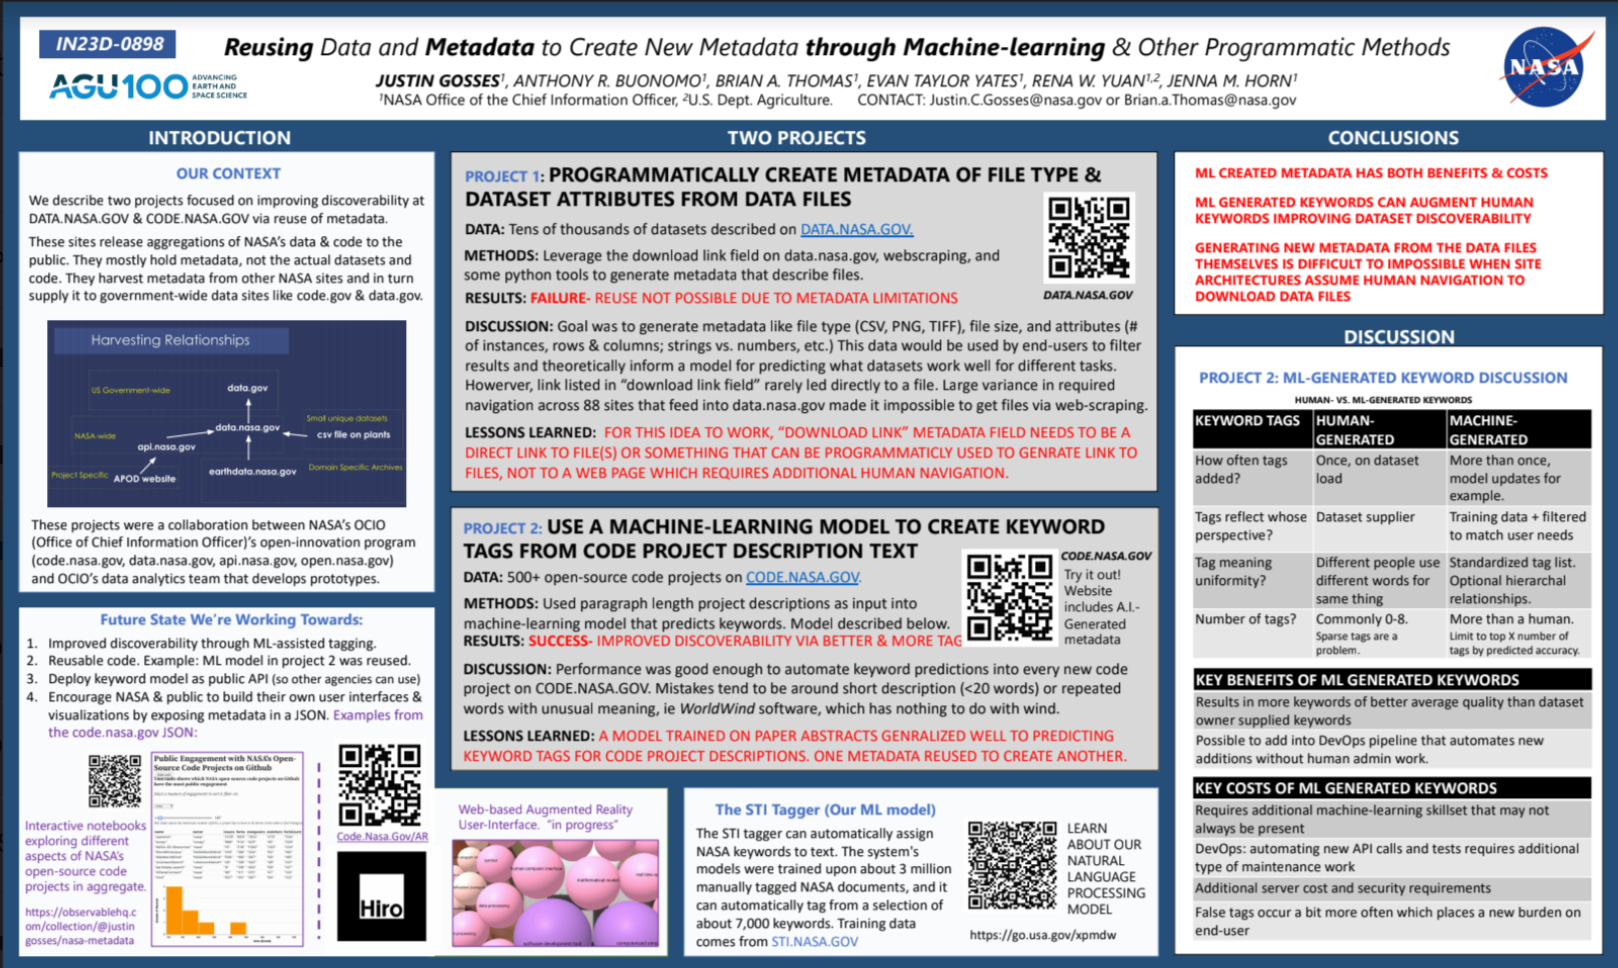
“THE CHANGING LANDSCAPE OF DATA VISUALIZATION TOOLS IN LARGE ORGANIZATIONS”
I recently gave a talk at the Houston Data Visualization meet-up. In addition to being a good excuse for putting time on my calendar to research the evolution of data visualization tools over the past 40 years, the talk allowed me to try out a few presentation related tools. Reveal.js is a user friendly framework for making presentations that consist of html, css, and JavaScript, just like any normal webpage. Slides.com is a hosting and GUI site for reveal.js slides. One of the best features of slides.com was being able to control the slides on my computer via my phone. This enabled me to walk around and not be as tied to my computer or rely on someone else to advance the slides. It also provides a nice way to briefly look down as you flip slides and sneak a glance at speakers notes. I used timeline.js from the Knight Lab at Northwestern university to create a timeline of key tool development that I referred to several times during the talk.
All the data for the presentation is in this github repo. I hope to revisit this presentation to take a second stab at it or perhaps turn it into a series of blog posts for work.


0 Comments